Factory Utilisation Rates and Capacity Analysis
Understanding how efficiently Malaysia’s factories operate and what’s driving production decisions in the E&E and automotive sectors.
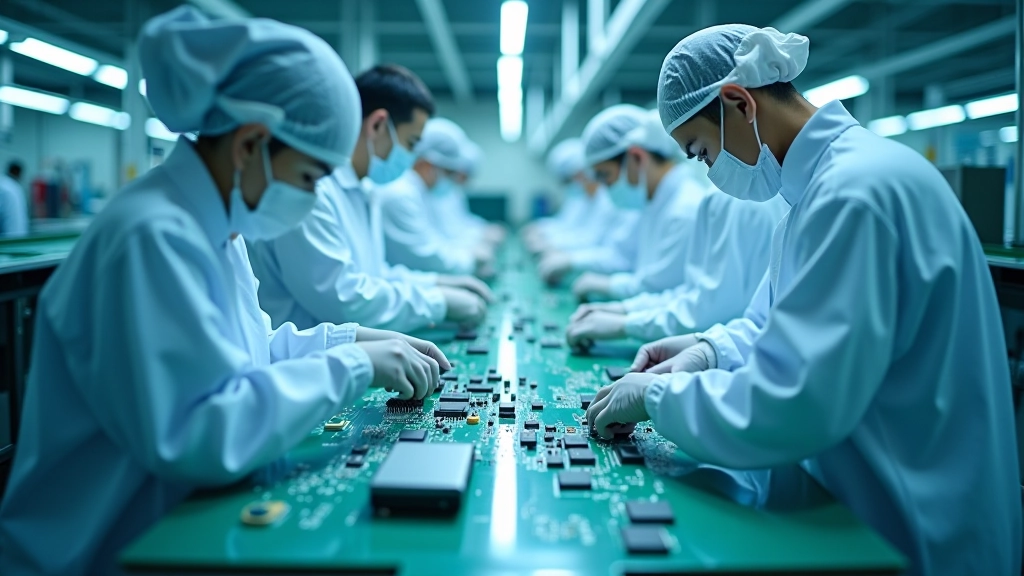
What’s Really Happening on the Factory Floor
Factory utilisation rates aren’t just numbers on a spreadsheet. They’re a direct window into how Malaysia’s manufacturing sector is performing. When you look at the data from 2024 onwards, you’ll see utilisation rates hovering between 72-78% across the electrical and electronics industry. That’s significant because it tells us factories aren’t running flat out, but they’re not idle either.
The automotive sector shows a slightly different picture. Plants here are typically running at 75-82% capacity, reflecting stronger domestic demand and export orders. But here’s the thing — these aren’t random fluctuations. They’re responses to global supply chain stability, component availability, and market demand. Understanding what drives these rates helps you see where the economy’s really headed.

The Key Drivers Behind Utilisation Rates
You’ve got several factors pushing utilisation rates up or down. Global demand for semiconductors and electronic components is the biggest one. When orders from Europe and North America increase, Malaysian factories ramp up production. We’ve seen this pattern repeat consistently since 2023, with utilisation rates spiking during Q2 and Q4 when international buyers place their seasonal orders.
Supply chain resilience matters too. After the disruptions of 2021-2022, manufacturers became more cautious about overcommitting capacity. They’d rather maintain 75% utilisation with stable margins than push to 95% and face sudden demand drops. It’s a calculated approach.
Current Market Dynamics
- E&E component demand remains steady from regional assemblers
- Energy costs influence shift scheduling and maintenance windows
- Semiconductor availability directly impacts downstream manufacturing
- Labour availability affects maximum operational capacity

Capacity Constraints and Optimization Strategies
Here’s where it gets interesting. Most Malaysian manufacturing plants have theoretical maximum capacity, but they don’t actually operate there regularly. Why? Because running at 95%+ utilisation creates maintenance backlogs, worker fatigue, and quality issues. Smart operators keep capacity headroom for exactly these reasons.
The automotive sector’s handling this particularly well. Major plants are investing in predictive maintenance systems that flag equipment issues before they cause downtime. This lets them maintain higher utilisation rates — often 78-80% — without sacrificing quality or reliability. E&E manufacturers are adopting similar approaches, though they’ve traditionally been more conservative with capacity allocation.
Energy efficiency is reshaping how factories think about capacity too. Rather than maximizing output per hour, they’re optimizing output per kilowatt. This means different shift patterns, equipment upgrades, and production scheduling that looks nothing like the old model.
What the Data Really Shows Us
Looking at Industrial Production Index data from the past 18 months reveals something important. E&E sector utilisation shows a steady upward trend from 71% in January 2025 to 77% by March 2026. That’s not dramatic, but it’s consistent growth reflecting genuine demand recovery. Automotive has been more volatile, swinging from 74% to 82% depending on specific model demand cycles.
“The factories aren’t struggling with capacity anymore. They’re struggling with consistency. Getting predictable demand patterns is harder than having the physical equipment.”
— Industry analyst perspective from March 2026
Regional competition is also shifting utilisation patterns. Thai and Vietnamese manufacturers are taking some work, pushing Malaysian plants to focus on higher-value components where their expertise creates a real advantage. This isn’t a problem — it’s actually healthy specialization.
Looking Ahead: What’s Next for Factory Capacity
Don’t expect utilisation rates to jump dramatically. Sustained growth in the 78-82% range is more realistic for 2026. That’s actually the sweet spot where factories operate efficiently without creating supply chain bottlenecks. Manufacturers have learned from previous cycles — they’re not chasing 90%+ anymore.
The real story is in sectoral shifts. Green technology component manufacturing is growing faster than traditional E&E work. Electric vehicle battery components and solar panel manufacturing are pulling capacity away from older product lines. By mid-2026, you’ll likely see specialised EV plants running at 85%+ while traditional assembly facilities hover around 72%.
Automation investments are accelerating too. Factories that’ve invested in robotics and AI-driven quality control can operate at higher utilisation safely. Those still relying on manual processes will probably stay more conservative. This creates a divergence — high-tech plants pulling ahead while others recalibrate their strategies.

Key Takeaways
Current State
Malaysian factories are operating at healthy utilisation levels (75-80%) with stable growth trends. This isn’t recovery mode — it’s normalized operations.
Strategic Focus
Efficiency and specialization matter more than raw capacity. High-value components and green technology are driving sectoral growth.
Future Direction
Expect divergence between automated and traditional plants. Technology adoption becomes the real competitive advantage going forward.
Factory utilisation rates tell a story about Malaysia’s manufacturing maturity. We’re not racing to maximum capacity anymore. We’re building sustainable, resilient production systems that can adapt to changing demand. That’s actual progress.
Informational Notice
This article provides educational information about factory utilisation rates and manufacturing capacity analysis in Malaysia. The data and statistics presented are based on publicly available Industrial Production Index reports and industry analysis from March 2026. Utilisation rates vary by facility, sector, and time period. Specific circumstances differ significantly between manufacturers. If you’re making business decisions based on capacity planning or market analysis, consult with industry specialists and access current official statistics directly. This content is informational only and doesn’t constitute business advice or forecasting for any specific organisation.