E&E Industry Performance Rebounds in 2026
Malaysia’s electrical and electronics sector shows strong growth signals. Export demand remains robust as global semiconductor and component requirements continue climbing…
Read MoreRecent IPI data reveals sector-by-sector performance variations. We’re analyzing what’s driving growth in some industries while others face headwinds from supply chain and demand factors.

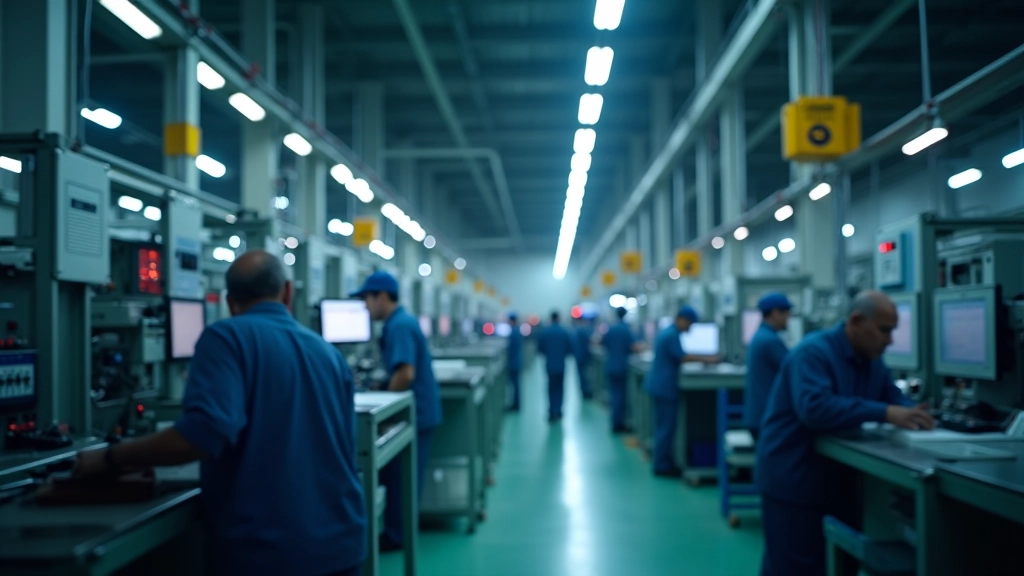
The Industrial Production Index (IPI) is basically a snapshot of how much stuff factories are making. It’s not just one number — it’s broken down by industry, so you can see which sectors are humming along and which ones are struggling.
Malaysia’s manufacturing sector employs over 700,000 people across electrical & electronics, automotive, chemicals, and food processing. When the IPI shifts, it tells us something important about the economy’s health. A rising index means factories are busy. A falling index? That’s a warning sign worth paying attention to.
The key insight: IPI doesn’t measure demand — it measures actual output. That’s the difference between what people want to buy and what factories are actually producing. Supply chain problems, labor issues, and equipment downtime all show up here.

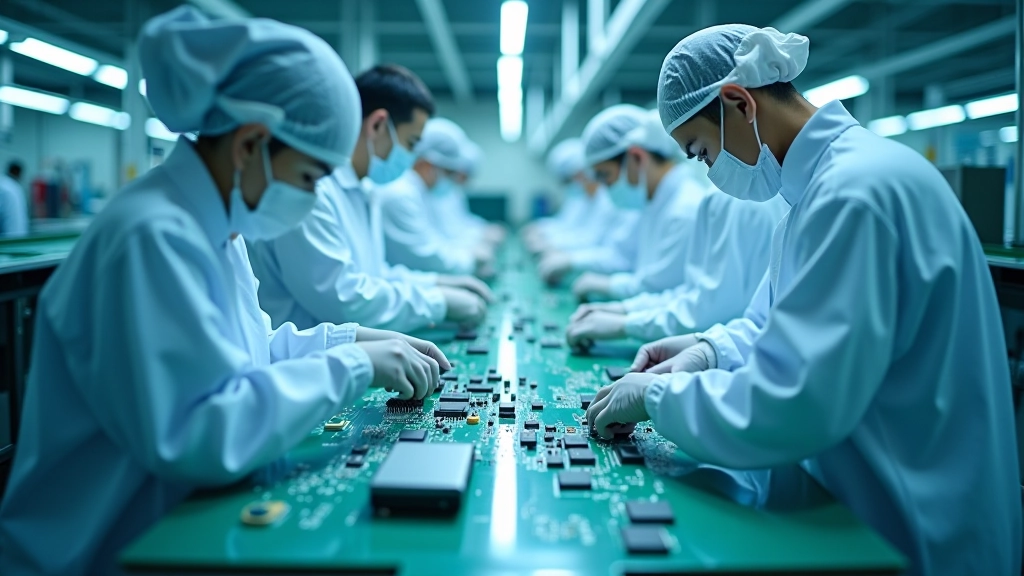
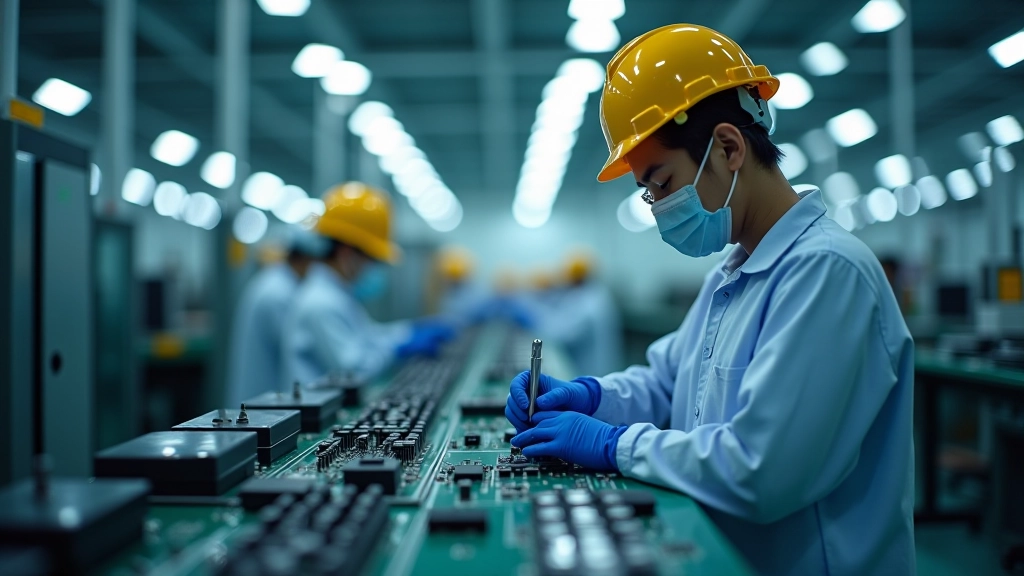
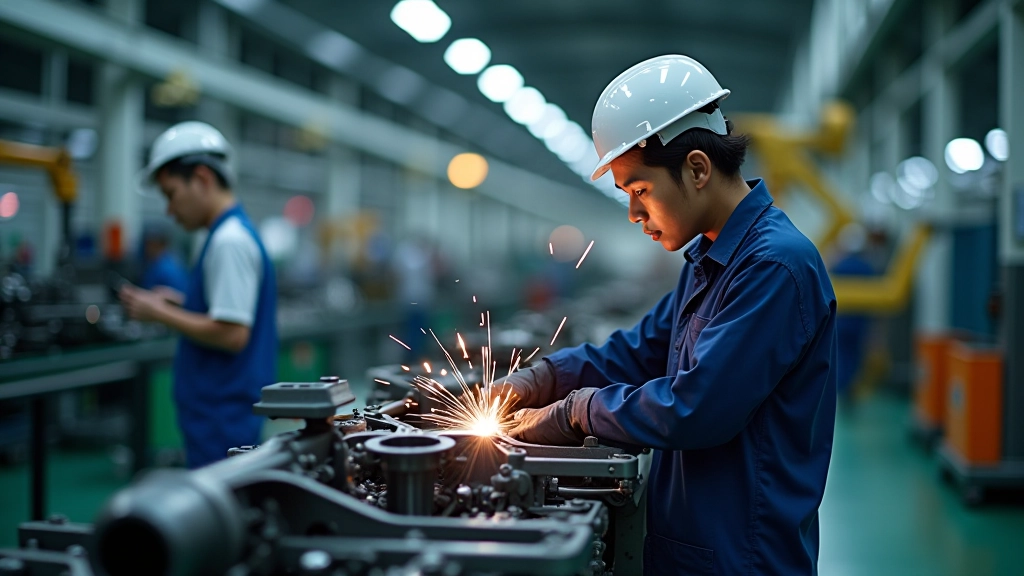
The electrical and electronics industry isn’t new to Malaysia, but it’s definitely evolving. We’ve seen consistent output growth because demand for semiconductors, printed circuit boards, and electronic components keeps climbing globally. Companies aren’t just making more — they’re making it more efficiently.
The E&E sector contributes roughly 15-18% to Malaysia’s total industrial production. That’s significant. Recent data shows utilization rates at major facilities hovering around 78-82%, which is healthy without being unsustainably high. When you hit 95%+ capacity, you’re asking for equipment failures and quality issues.
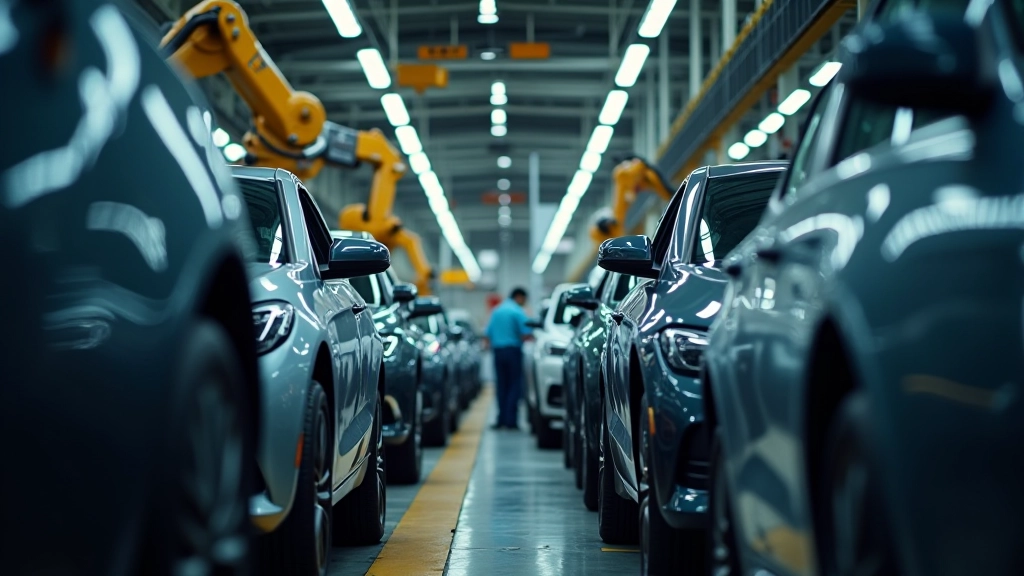
Automotive manufacturing in Malaysia doesn’t get the same headlines as E&E, but it’s still a major economic player. Vehicle assembly and component production account for roughly 8-10% of the IPI. What’s interesting is the shift happening right now.
Traditional vehicle assembly is steady, but electric vehicle component manufacturing is growing fast. We’re talking about battery housings, motor components, and electrical systems. Companies are investing in new equipment and retraining workers. That’s not always reflected immediately in raw output numbers, but it shows up in capacity spending.
Here’s what people don’t always understand about IPI: it’s influenced heavily by what’s happening in your supply chain. You could have orders lined up, skilled workers ready to go, but if your raw materials or components aren’t arriving, your production number stays low.
Post-2022 improvements have been real. Semiconductor shortages eased. Shipping times normalized. But new challenges popped up — geopolitical tensions affecting certain sourcing regions, wage pressures in labor-intensive sectors, and energy costs that don’t want to come down. These factors show up as capacity constraints before they show up as price increases.
“IPI doesn’t lie. When your production numbers are flat or declining while your order book is full, you’ve got a bottleneck somewhere in your system.”
— Manufacturing analyst perspective

Rising IPI suggests healthy demand and economic momentum. When manufacturers are running near capacity and still growing output, that’s genuine economic expansion happening.
Declining or flat production when capacity exists means demand is weakening. This often precedes broader economic slowdown. It’s an early warning system that deserves attention.
IPI growth without corresponding employment growth suggests productivity improvements. That’s positive for long-term competitiveness but requires worker upskilling.
Strong IPI in export-oriented sectors means Malaysia remains competitive globally. Weak numbers might indicate pricing pressure or market share loss to other countries.
The Industrial Production Index isn’t just a number for economists to argue about. It’s a real-time reflection of what’s happening in Malaysia’s factories. When you see it rise, factories are busy, workers are employed, and supply chains are flowing. When it falls, something’s wrong — and it’s worth understanding what.
The E&E sector continues to be the growth engine, automotive is in transition toward electric components, and supply chain resilience remains critical. These aren’t separate stories — they’re interconnected parts of Malaysia’s manufacturing ecosystem.
Whether you’re tracking this for business decisions, investment choices, or just understanding the economy better, IPI data deserves serious attention. It’s one of the clearest windows into actual economic activity happening right now.
This article provides informational content about Malaysia’s Industrial Production Index and manufacturing sector trends. The data, statistics, and analysis presented are intended for educational purposes only. While we’ve made effort to ensure accuracy, economic indicators and production metrics change frequently. This content shouldn’t be used as the sole basis for business decisions, investment strategies, or policy recommendations. For specific business or investment decisions, consult with qualified professionals who can assess your individual circumstances. Manufacturing conditions, supply chains, and economic factors vary significantly by company and sector.